Révéler la concentration en dioxyde d'azote en surface à haute résolution grâce à l’apprentissage automatique
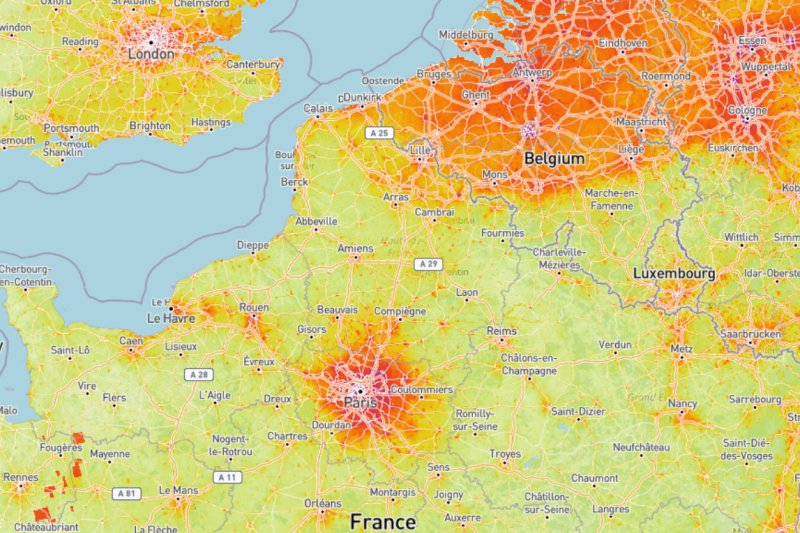
Surveiller et améliorer la qualité de l'air est essentiel pour protéger notre santé publique et préserver l'environnement. Avec une population en constante augmentation et un climat en évolution, nous observons une augmentation des émissions provenant des processus industriels, des véhicules, des feux de forêt, des tempêtes de poussière, de la consommation énergétique accrue, etc. Comment pouvons-nous surveiller la situation ? Quels outils sont disponibles pour développer des stratégies de réduction ? Terrascope propose une série de cartes de la qualité de l'air, y compris une concentration quotidienne de NO₂ en surface. Découvrez-en plus sur ce produit innovant dérivé à l'aide d'un cadre avancé d'apprentissage automatique (ML) qui intègre des ensembles de données multi-sources pour calculer la concentration moyenne quotidienne de NO₂ en surface à une résolution de 1 km pour l'Europe occidentale.
La version complète en néerlandais sera bientôt disponible.
The need for ground level NO2 concentration maps
Nitrogen dioxide (NO2) has received considerable attention due to its adverse effects on human health and air quality. Accurate estimation of surface NO2 concentrations is critical for assessing its impact and implementing targeted mitigation strategies. Although satellite sounders like TROPOMI provide NO2 atmospheric column observations on a global scale, the conversion of coarse-resolution column densities into high-resolution surface concentrations requires complex methodological development. Conventional chemical transport models, despite incorporating detailed physical and chemical knowledge, face challenges in mapping high-resolution surface NO2 due to significant computational burdens. To overcome these obstacles, BIRA-IASB successfully conducted PhD research to derive ground level NO2 concentration from TROPOMI data. They developed an efficient machine learning (ML) framework that uses satellite observations together with diverse multi-source datasets to infer daily average surface NO2 concentrations at 1 km resolution which is now available in our Terrascope viewer.
A new machine learning model to estimate surface NO2 distributions
Machine learning is becoming increasingly popular in the atmospheric research community, especially with the rapid development of computational power and the increased availability of big data. In this study, BIRA uses supervised learning strategy with in-situ data to train ML models of the relationship between surface NO2 and the following predictors before applying the model to estimate surface NO2 concentrations at locations where in-situ measurements are not available.
- Sentinel-5P TROPOMI NO2 observations
- Meteorological data
- Emission inventories
- Land use information
- Temporal data
- Spatially lagged data
While the ML model does not explicitly encode the underlying chemical and physical processes, it can establish a complex mapping relationship from these predictor variables to daily surface NO2 concentrations at 1 km resolution. The ML model is based on XGBoost and is called BEnCQE (Boosting Ensemble Conformal Quantile Estimator). The BEnCQE model can provide not only the NO2 concentrations but also the prediction interval reflecting the uncertainty for each estimate. More information is available in this paper.
The benefits of using Nitrogen Dioxide concentration maps
Implement new regulations and monitor the impact
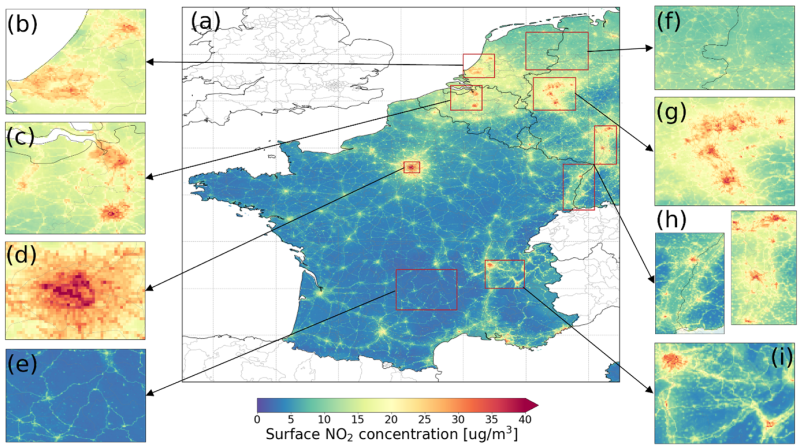
The surface NO2 concentration maps provide detailed information about the distribution of surface NO2. These maps support authorities to determine mitigation strategies and monitor the impact of related policies and events such as car free Sunday, low emission zones, … . The figure on the right shows the distribution of surface NO2 over Western Europe for the period May 2018 to December 2021. At a resolution of 1 km, we can detect the detailed spatial gradient of surface NO2 and find the NO2 hotspots. It shows that the highest NO2 concentrations are mainly located in urban and industrial areas and major roads can also be detected. While rural areas generally have low surface NO2 concentrations (e.g. figure (e), Massif Central, France), relatively high NO2 concentrations are observed near major roads. By using the daily surface NO2 concentration maps available in the Terrascope viewer, you can monitor the NO2 spatial patterns and its variability on a daily basis and extract time series to visualize the impact of events of new air quality related policies.
Monitoring the exceedances of the WHO’s imposed NO2 limit
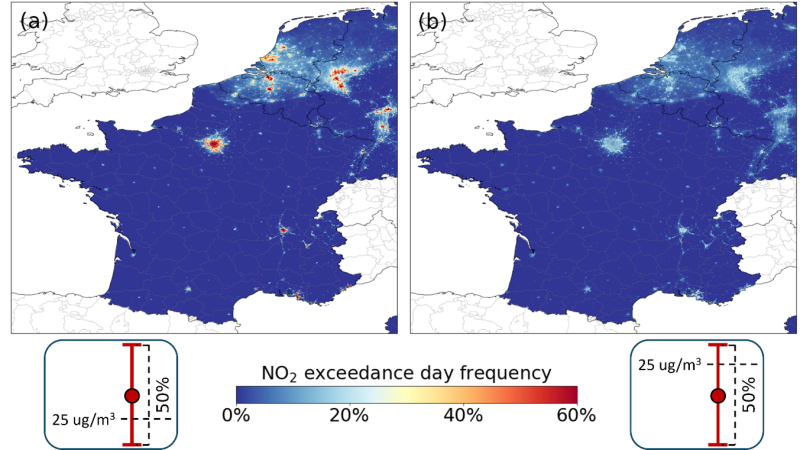
The World Health Organization provides Air Quality Guidelines (WHO AQGs) which set a global reference for setting air quality standards. These guidelines offer scientifically-backed recommendations to support clean air policies and reduce the health effects of air pollution. WHO’s 2021 Air Quality Guidelines set a daily NO2 limit of 25 µg/m3. The figure on the left shows the frequency of NO2 exceedances of the WHO limit from May 2018 to December 2021. Figure 2a highlights a significant NO2 exceedance in urban areas, with additional exceedance signals observed in rural regions of densely populated countries like Belgium and the Netherlands. Due to uncertainties in the data, NO2 pollution may not be fully captured. Therefore, we complement the exposure analysis by recording potential NO2 exceedances, defined as cases where the point estimate is below the WHO limit, but the expected range of NO2 concentrations (i.e. the PI-50% range) crosses this threshold. As shown in Figure 2b, potential exceedances are common (ranging from 10% to 30%) and extend beyond known NO2 hotspots, affecting smaller cities, suburban areas, and roads in mountainous regions.
Facts & Figures
7.14±4.41
Average surface NO2 concentration in Western Europe from May 2018 to December 2021
30-60%
The NO2 exceedance rate is between 30% and 60% for the NO2 hotspot regions from May 2018 to December 2021.
2018
Access daily, monthly and yearly surface NO2 maps since 2018 via the Terrascope viewer.
Products and services
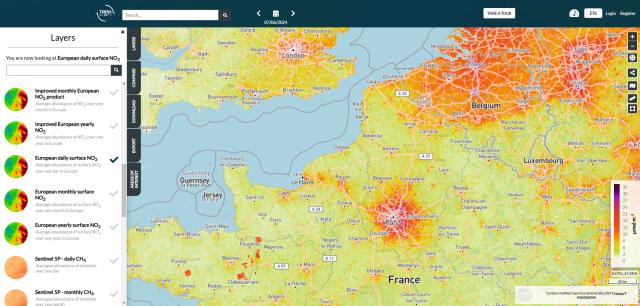
Sentinel-5P European daily surface NO2
The daily surface NO2 product can be accessed via the Terrascope viewer. The monthly and yearly average products are also available on the platform.

Sentinel-5P improved European daily surface NO2 product
The NO2 column density observed by the satellite is an important predictor for the machine learning model to estimate the surface NO2 concentration. This predictor informs the model about NO2 dynamics on a large scale.
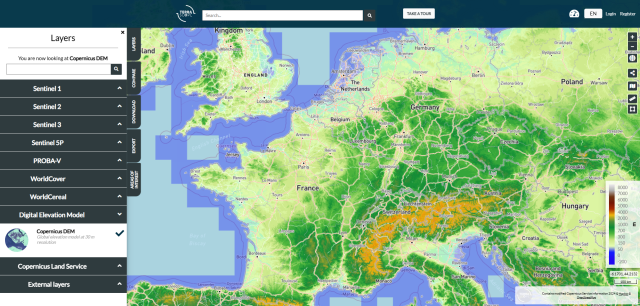
Copernicus DEM
The Digital Elevation Model (DEM) is an important indicator to inform the machine learning model about the topography to help the model capture the surface NO2 concentration distribution.
Ce cas a été publié en collaboration avec BIRA-IASB
