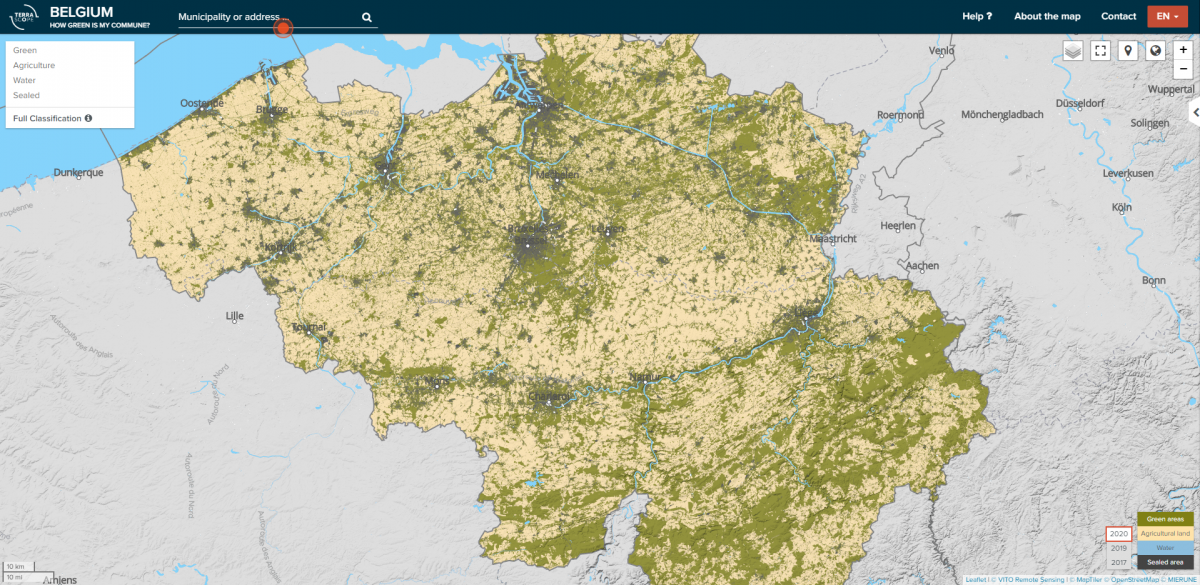
‘How green is my municipality’ adds a new land cover classification map
How green is my municipality has added a new 2020 land cover map. This demonstration project was launched in 2018 with a first land cover map for 2017 to easily demonstrate how satellite images and other Earth observation data can be used to provide objective and valuable information about our land cover and land use. Later on a 2019 map was published and now there’s also an update available for 2020.
‘How green is my municipality’ is a basic classification of all Belgian cities and municipalities based on images from various Copernicus Sentinel satellites. The classification map shows how many green areas, agricultural fields, water and non-vegetated areas there are and where they are located. You can easily look up how 'green' a municipality or city is, compare it with other municipalities or cities and view and compare land use statistics over the years.
- First map of 2017
The first map of 2017 was compiled on the basis of the Normalized Differential Vegetation Index. A basic classification was made between water, vegetated and non-vegetated areas (the vegetated surfaces were subsequently split into agriculture and other vegetation).
- Update of 2019 and 2020
For the 2019 and 2020 maps, we went a step further. During development, we used Sentinel-1 and Sentinel-2 satellite images, other reference datasets (e.g. an elevation model) and training data. By using artificial intelligence techniques, we can classify about 10 land cover classes. For this demonstration project they were simplified to the same 4 classes as the first map.

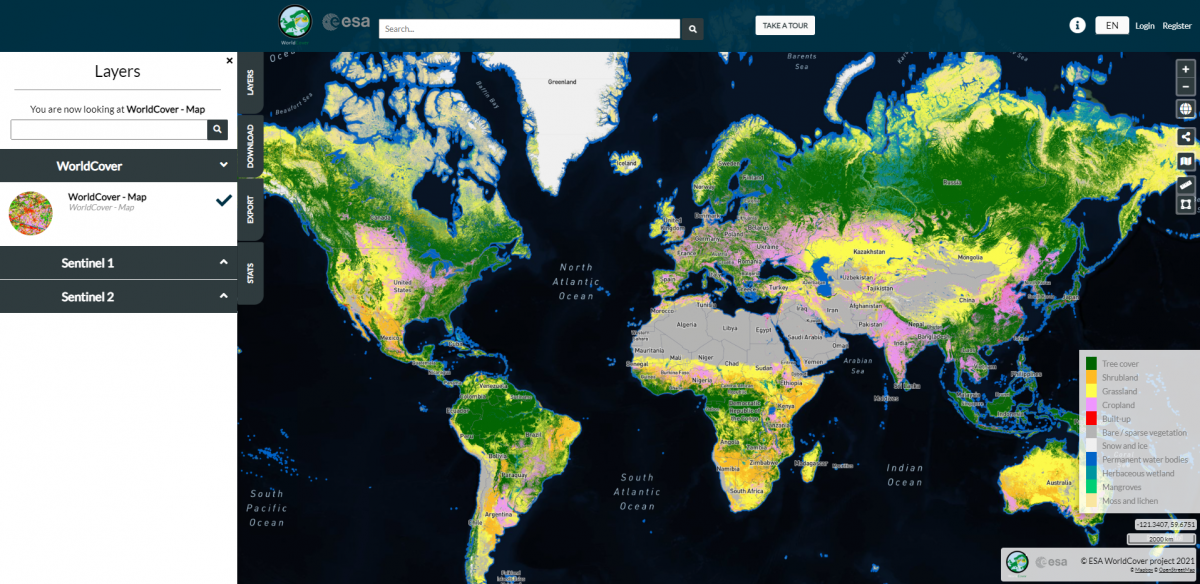
WorldCover, global land cover map at 10 m resolution
The 'How green is my municipality’ website provides a basic classification and is not used for scientific purposes. When we use more Earth observation data and remote sensing techniques, we can refine the information even further, which is necessary for operational decision processes and to support scientific studies. A good example is the ESA WorldCover map, a global land cover map at 10 m resolution with 11 different classes. This global map can be accessed for free via https://viewer.esa-worldcover.org/worldcover/. More information about the Copernicus Sentinel satellites, the most recent images and possible applications can be found at www.terrascope.be.