Urban Heat Island mapping with combined Sentinel-2 and Sentinel-3 observations
Foreshadowing the upcoming release of Sentinel-3 Land Surface Temperature (LST) data in Terrascope at the end of this year, we give you a peek into an application which combines Sentinel-3-derived LST and Sentinel-2 reflectance data to improve the nominal 1 km LST to 20 m. These data provide valuable and detailed information on for example the Urban Heat Island effect and are beneficial to evapotranspiration modeling. Discover more about these high-resolution LST data including an example over the city of Brussels of 19 July 2022 when we witnessed an extreme heat.
Land Surface Temperature over urban areas
Deriving Land Surface Temperature (LST) from Thermal Infrared (TIR) satellite measurements has already been performed for several decades (e.g. from Landsat and MODIS) and has mainly been applied to agriculture, for example to estimate evapotranspiration (ET) and for early crop water shortage estimation in order to irrigate parcels more timely and precisely. Another interesting application is to gain insights into the day- and nighttime LST evolution over urban areas.
With the increased heat wave occurrence because of global temperature increase, urban environments are more prone to exhibit exceptionally high temperatures during both day- and nighttime, which in turn leads to health issues, such as sleep deprivation, overheating, and respiratory problems (especially in combination with poor air quality). High-resolution LST data provide valuable information for city planners and climate modelers to gain detailed insights into which parts of a city are most susceptible to extreme temperatures and on how to mitigate these effects.

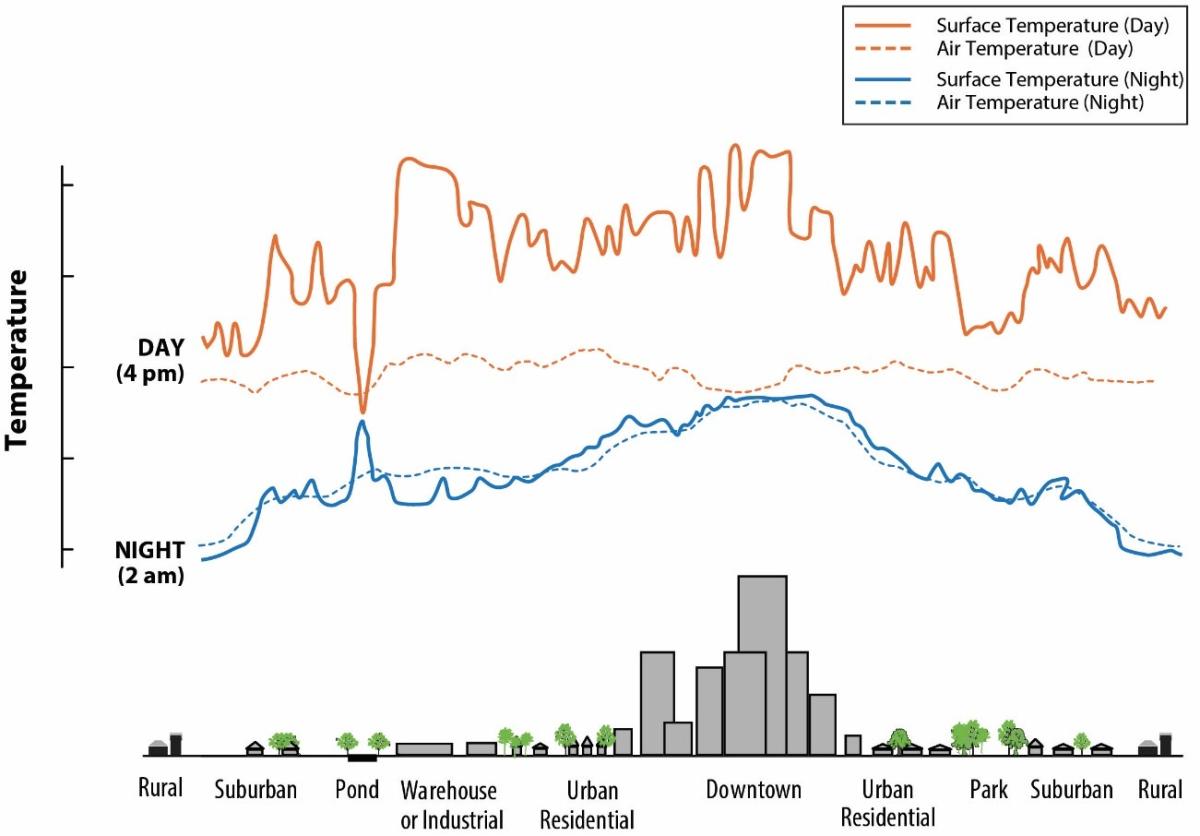
Urban Heat Islands (UHIs) are caused by the large number of cities’ concrete roads, pavements, and buildings. These materials absorb solar irradiance more than they reflect it. Additional heat builds up because of waste heat from human activities. In contrast, the surrounding rural areas comprise abundant vegetation, which not only absorbs less solar irradiance, but also cools the atmosphere through evaporation.
As a consequence, an inner city’s temperature can be several degrees higher than its surroundings during both day- and nighttime (see figure to the right) and this can cause severe health effects during hot summer days, especially when the heat persists for several days without any significant wind.
Land Surface Temperature data provide valuable information for city planners and climate modelers
Using Sentinel-2 surface reflectance to improve the Sentinel-3 LST resolution
Obtain high-resolution LST
The basis for improving the LST spatial resolution is a method conceived by Gao et al. (2012), in which Landsat visible (VIS) and near-infrared (VNIR) reflectance data were used to improve the LST’s spatial resolution from 90 m to 15 m. Their method generates linear reflectance versus brightness temperature regressions for several spectral channels. These regressions, as well as viewing and illumination angles and Digital Elevation Model (DEM) data, are used to obtain high-resolution LST.
Sentinel-2 surface reflectance
In our approach, we used Terrascope Sentinel-2 surface reflectance data from the BLUE through SWIR channels. First, 10-day cloud-free Sentinel-2 surface reflectance composites were generated, which in turn were used to obtain the linear surface reflectance vs LST regressions for all Sentinel-2 spectral bands. Finally, the high-resolution (20 m) LST was obtained using the method from Gao et al. (2012).
Sentinel-3 LST at 20 m
The 20 m Sentinel-3 LST is an important input parameter for ET models, because a more fine-grained LST estimate provides a more detailed ET model initialization in terms of turbulent flux calculations. In addition, the high-resolution LST provides other interesting applications, such as detailed UHI analyses.
Below, we show the first results of high-resolution LST over the Brussels area for the extreme heat event that occurred on 19 July 2022, with maximum temperatures approaching 40oC in the Netherlands and Belgium and even higher in the UK, France, and Spain.
A view on Brussels metropolitan area on 19 July 2022
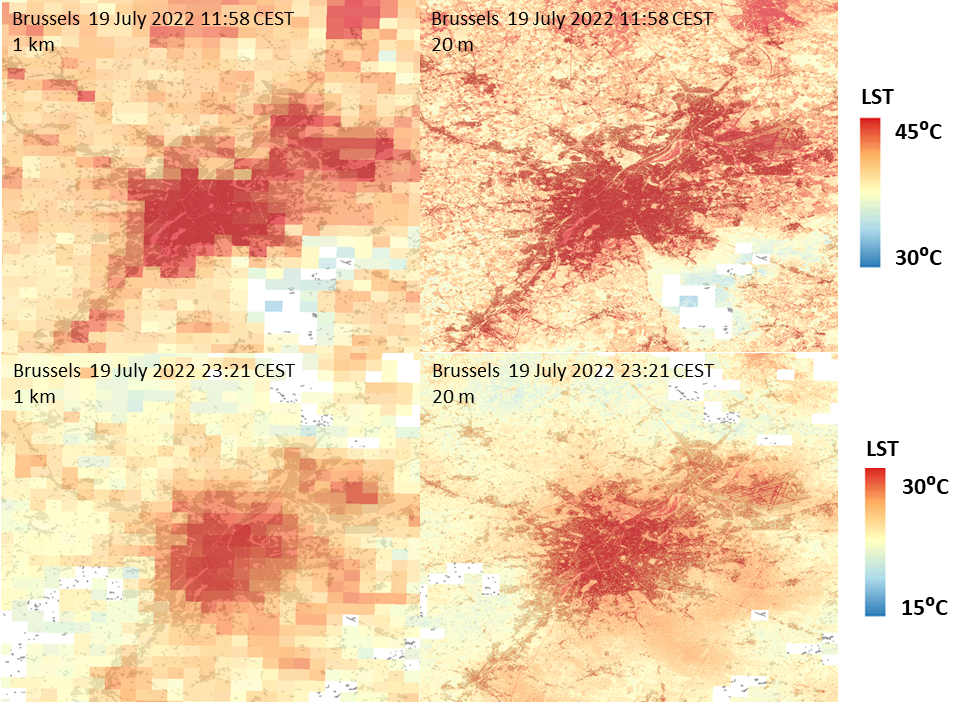
The figure below shows the original 1 km Sentinel-3 LST (left) and the high-resolution LST at 20 m (right) over the Brussels metropolitan area on 19 July 2022 at 11:58 and at 23:21 Central European Summer Time (CEST). Areas indicated in white contained clouds in the original LST data. This example clearly shows that using Sentinel-2 surface reflectances to improve the original Sentinel-3 LST provides a large amount of detail and small-scale LST differences.
In addition, the temperature difference between the city and its surroundings is striking. At 11:58 CEST, the LST in several parts of the city centre of Brussels already exceeds 45oC, while in the Sonian Forest to the south of Brussels LST is relatively cool with 30–35oC. Note that the Sentinel-3 observation is 4–5 hours before the maximum temperature was reached (38.1oC measured at 1.5 m at Uccle weather station), so at some locations the LST inside Brussels could have eventually exceeded 50oC. In the evening (~1.5 hour after sunset), most of Brussels city still has LST close to 30oC, while further outside the city values have already dropped to 20–25oC.
High-resolution LST data are beneficial to urban climate modelers and city planners to validate the climate models and obtain detailed information on cities’ parts that are most susceptible to high temperatures, in order to take objective decisions to mitigate the urban heat island.

Mitigate extreme heat-induced health impact
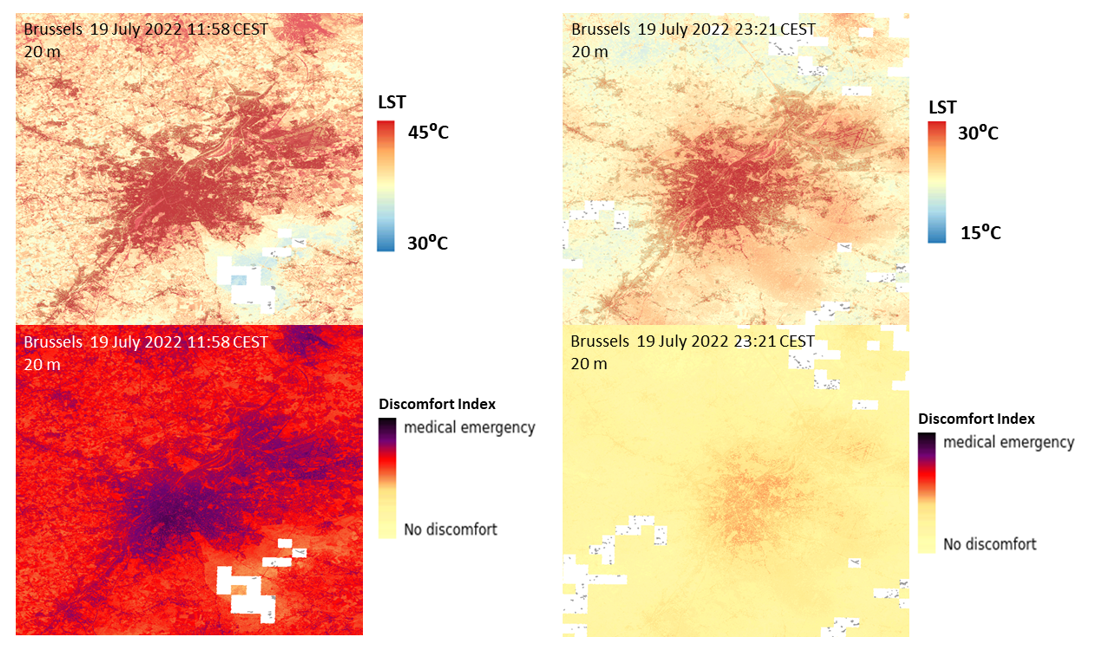
A generally accepted way of indicating the heat discomfort to humans is the so-called Discomfort Index (DI, Thom, 1959), which is based on air temperature at 1.5 m (in oC) and relative humidity (RH, in %). This index has been adapted for LST usage instead of air temperature. DI runs from < 21 (no discomfort) to > 32 (medical emergency). The figures below present the DI for 19 July 2022 at 11:58 and 23:21 CEST based on the 20 m LST and RH values observed at Uccle weather station. On 19 July 2022 during daytime, the DI was 30–33, which implies that everyone would at least experience severe heat stress, while in the surroundings DI values were 24–28, with the lowest values in the Sonian Forest. During the evening of 19 July 2022, DI values decreased to 24 – 26 (‘over 50% of the population feels discomfort’) inside Brussels and to 19 – 22 (no or only slight discomfort) in the surroundings. The nighttime DI values were not that extreme in this case, because a westerly wind gradually brought in cooler air (Uccle recorded a minimum of 17.3oC), but nighttime temperatures well above 20oC would be indicative of higher DI and thus larger heat stress.
To mitigate extreme heat-induced health impact in cities, these high-resolution LST data are very valuable to city planners to gain insight into cities’ heat patches and to act upon this, for example by inserting more vegetation into concrete areas. Further, climate modelers can use these data both as validation source and for better model initialization. Additional to these sharpened Sentinel-3 LST data, several satellites carrying thermal instruments capable of observing LST at ~50 m resolution, such as NASA’s ECOsystem Spaceborne Thermal Radiometer Experiment on Space Station (ECOSTRESS, see a recent post on the June 2022 European heatwave), ESA’s planned Land Surface Temperature Mission (LSTM, launch foreseen for 2029), as well as several planned micro-satellite constellations, will enable detailed analyses of the Earth’s LST at (sub-)daily scale, to further improve UHI and ET monitoring and modeling at both high temporal and spatial resolution.
Products and Services

Sentinel-2
Sentinel-2 surface reflectance data were used to improve the Sentinel-3 LST resolution to 20 m.

Sentinel-3
Sentinel-3 Land Surface Temperature data were used as basic data source.

Virtual Machines
Terrascope Virtual Machines were used to implement the sharpening method for generating the high-resolution LST maps.